Bioinformatic Services
At the GCTU, we offer a range of off the shelf data analysis services to help you analyse your NGS data rapidly and with confidence. Our in house Bioinformaticians have a wealth of experience analysing large and complex NGS data sets, with a particular focus in single cell RNAseq and differential DNA methylation analysis. We also support custom analysis requests, e.g. analysis of publicly available datasets. Please reach out to genomics@qub.ac.uk with any analysis queries you may have.
GCTU Data Analysis Services
-
FASTQ Generation, FastQC analysis & generation MultiQC report, data sharing via CrushFTP and data storage for 1-year
- This is included as standard with all NGS projects run by the GCTU
- FastQC and MultiQC are used to evaluate the quality of raw sequencing data and generate summary reports to identify any issues or biases that may affect downstream analysis.
-
RNAseq data - primary alignment (any species) and gene count generation
- Provision of bam and gene count files
- Read Alignment: STAR is used to align the cleaned reads to the reference genome of choice to determine the origin of each sequenced fragment.
- Read Counting: HTSeq is used to count the number of reads mapping to each gene to quantify gene expression levels.
-
RNAseq data - Differential gene expression analysis and Pathway analysis (Human only)
- Provision of range of plots, including PCA and interactive Glimma plots to probe differentially expressed genes in your data set. Note - we require a minimum of 2 replicates per group and a list of comparisons to be assessed.
- Normalisation: Gene expression data is normalised to account for differences in sequencing depth and other technical biases across samples.
- Quality Assessment: SAMtools, Picard and Qualimap are used to assess the quality of read alignments, detect PCR duplicates, and evaluate the overall quality of the alignment and mapping process.
- Differential Gene Expression Analysis (DGEA): DESeq is used to identify genes that are differentially expressed between experimental conditions, providing insights into genes associated with specific biological processes or conditions.
- Pathway Analysis: Enrichr and ClusterProfiler (utilizing KEGG, GO, and MSigDB databases) are used to identify enriched biological pathways and gene ontology terms associated with differentially expressed genes, providing insights into the biological processes affected by experimental conditions.
-
Differential DNA Methylation analysis - nfcore/methylseq
- Analysis of methylation data (e.g from Twist Human Methylome service or Bisulfite sequencing data). User can chose the data to be analysis via Bismark or bwa-meth as preferred.
- The nf-core/methylseq pipeline processes methylation data to analyse DNA methylation patterns. It performs quality control, aligns reads, and extracts methylation information at cytosine sites. The pipeline generates comprehensive reports and methylation call files, which can be used for further analysis. More information can be found here.
- The GCTU has developed an in-house edgeR pipeline which can be used to identify differentially methylated cytosines between experimental conditions.
-
Normalisation The package normalises the counts to account for differences in sequencing depth and other technical variations between samples.
-
Dispersion Estimation edgeR models the count data using a negative binomial distribution, which accounts for biological variability. The dispersion parameter is estimated to capture this variability, which is crucial for accurate differential analysis.
-
Differential Methylation Analysis Using the negative binomial model, edgeR performs statistical tests to identify CpG sites or regions with significant differences in methylation levels between experimental groups (e.g., treated vs. control). This is done by fitting generalised linear models to the data and using likelihood ratio tests or other statistical methods to determine significance.
The output includes a list of differentially methylated regions or sites, along with statistics like fold changes and p-values, which can be used to interpret the biological significance of the methylation changes.
-
-
Single cell data - 10X Genomic Cell Ranger
- Included a standard for 10X Genomics single cell projects run by the GCTU
- The Cell Ranger pipeline processes single-cell RNA-seq data by first extracting barcodes and UMIs, aligning reads to a reference genome, and quantifying gene expression through UMI counting. It distinguishes real cells from background noise, generates a gene expression matrix, and performs clustering and visualization of cells. The pipeline outputs summary reports, gene expression matrices, and visualization files, which can be further analyzed. More info can be found here.
- The GCTU offers additional single cell RNAseq analysis using e.g. Seurat or Scanpy.
-
Spatial transcriptomic data - 10X Genomic Space Ranger
- Included as standard for all Visium and Xenium projects run by the GCTU.
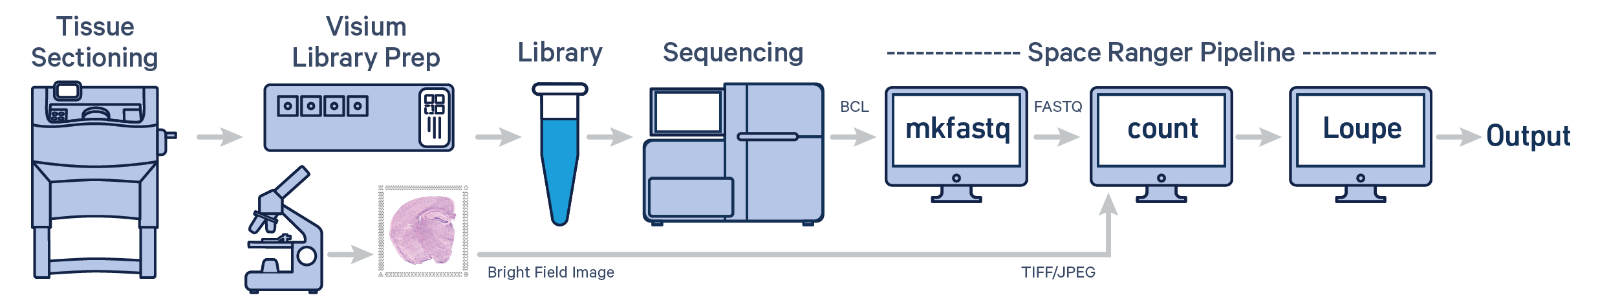
- Visium & VisiumHD - raw sequencing data is processed through 10X Genomics Space Ranger
- The 10x Genomics Space Ranger pipeline is a comprehensive tool for analyzing spatial transcriptomics data obtained from the Visium platform. Here's a brief overview:
- Input Data: The pipeline starts with raw sequencing data and spatial tissue imaging data from Visium slides.
- Preprocessing: It aligns the sequencing reads to a reference genome and processes spatial imaging data to map gene expression to specific tissue locations.
- Barcode and UMI Processing: The pipeline decodes the barcoded spots and Unique Molecular Identifiers (UMIs) to quantify gene expression while maintaining spatial context.
- Spatial Mapping: It integrates gene expression data with spatial coordinates, generating detailed spatial gene expression maps.
- Analysis and Visualization: The pipeline provides tools for visualizing gene expression patterns across tissue sections, including generating heatmaps and spatial plots.
- Output: The results include spatially resolved gene expression matrices and visualizations, enabling insights into tissue architecture and molecular processes.
-
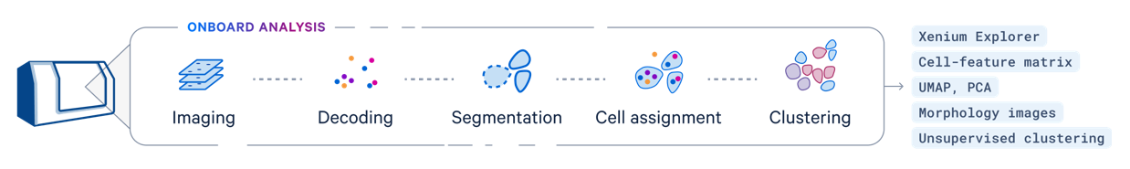
- Xenium Data - imaging data is processed in real time during the Xenium run - please see overview below:
-
Data Acquisition: The process begins with Xenium slide data, which includes high-density spatial barcoding and tissue imaging.
-
Preprocessing: The raw sequencing data is processed to align reads to a reference genome, while spatial imaging data helps map gene expression to specific tissue locations.
-
Barcode and UMI Decoding: The pipeline decodes spatial barcodes and Unique Molecular Identifiers (UMIs) to accurately quantify gene expression for each spatial location.
-
Spatial Mapping: Gene expression data is integrated with spatial coordinates, generating high-resolution maps of gene activity within the tissue.
-
Analysis and Visualization: The results include detailed spatial gene expression maps and visualizations, such as heatmaps and spatial plots, to analyze gene expression patterns and tissue architecture.
-
Output: The final output provides a comprehensive spatial gene expression matrix and visual tools for interpreting tissue-specific molecular information.
-
- Xenium Data - imaging data is processed in real time during the Xenium run - please see overview below:
-
Nextflow nf-core pipelines
- The GCTU can perform a range of nf-core pipelines as requested. We currently have a number available off the shelf, but can set up, test and perform any available as requested with a rapid turnaround time.
- Full list of pipelines available can be found here.